
Reports: “Potential” Interactions Report

** Maybe Remove ** A Potential Interaction Reports primary function is simulating the new affect of a location entering an established network. This can be seen as potential cannibalisation of a new store or the impact from new competitor locations. Along with simulating this new affect, a site sales estimate can be built using the remaining location demand for the location. ** Maybe Remove **
A Potential Interaction Report has multiple use cases:
Location Demand for Potential Locations
Potential Impact of new locations to an Existing Network
Site Sales Estimate
This Report will be broken into 2 steps:
How to Create a Potential Interaction Report
Understanding a Potential Interaction Report
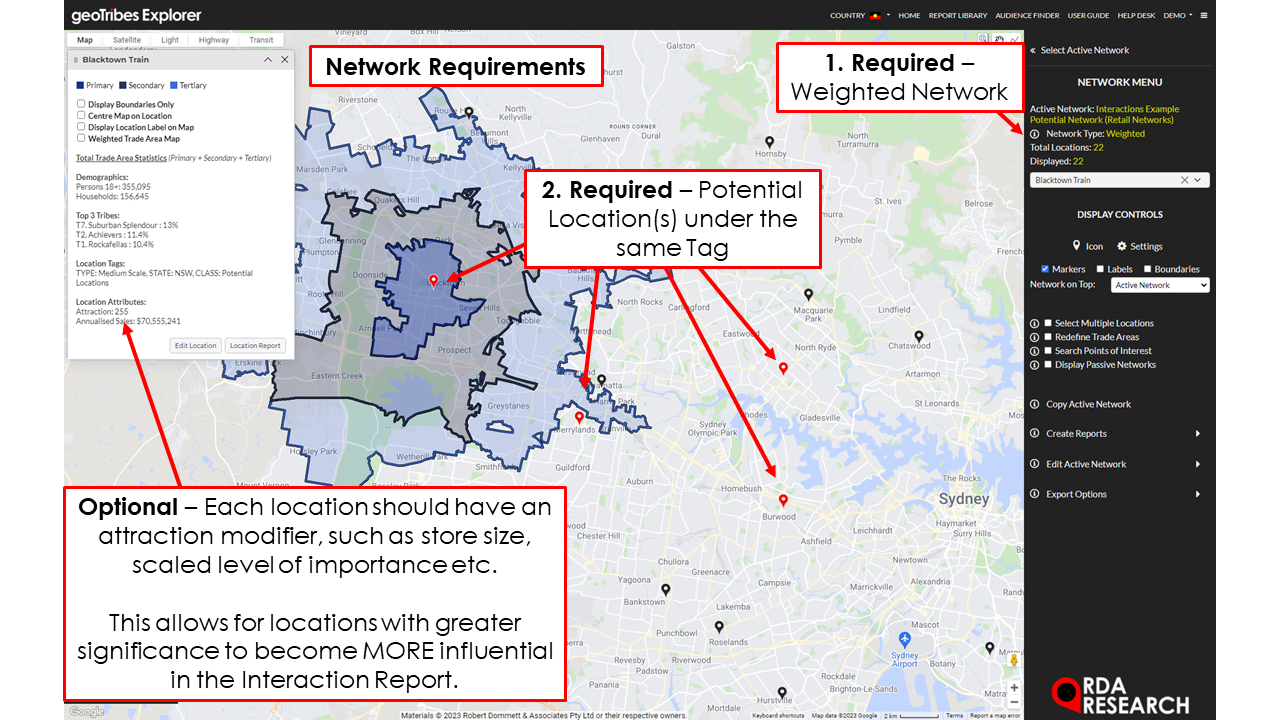
What you will need
A weighted network - This network should consist of all store locations relevant to the user. This could include competitor locations if necessary. This network of weighted values depending on how it was created could be from “Redefining Trade Areas” or created by RDA.
Potential Location(s) - Within the weighted network, location(s) should be assigned Tags to allow them to be assigned as potential locations for the interaction report.
Optional - Will improve your Reports capabilities:
Attractiveness parameter - Weight statements provide a way of scaling the importance of a location. This represents how consumers can be influenced on factors such as store size or a competing brands relevance to the user network being analysed.
A Base Layer - The market the locations are competing over. This could represent a modelled population of potential customers locations would be competing over.
Create Potential Interactions Report

To create a Potential Interaction Report:
Select your Weighted Network to perform Interactions on.
Select 'Create Reports' then 'Interactions'
Follow the on-screen instructions to set the Report details:
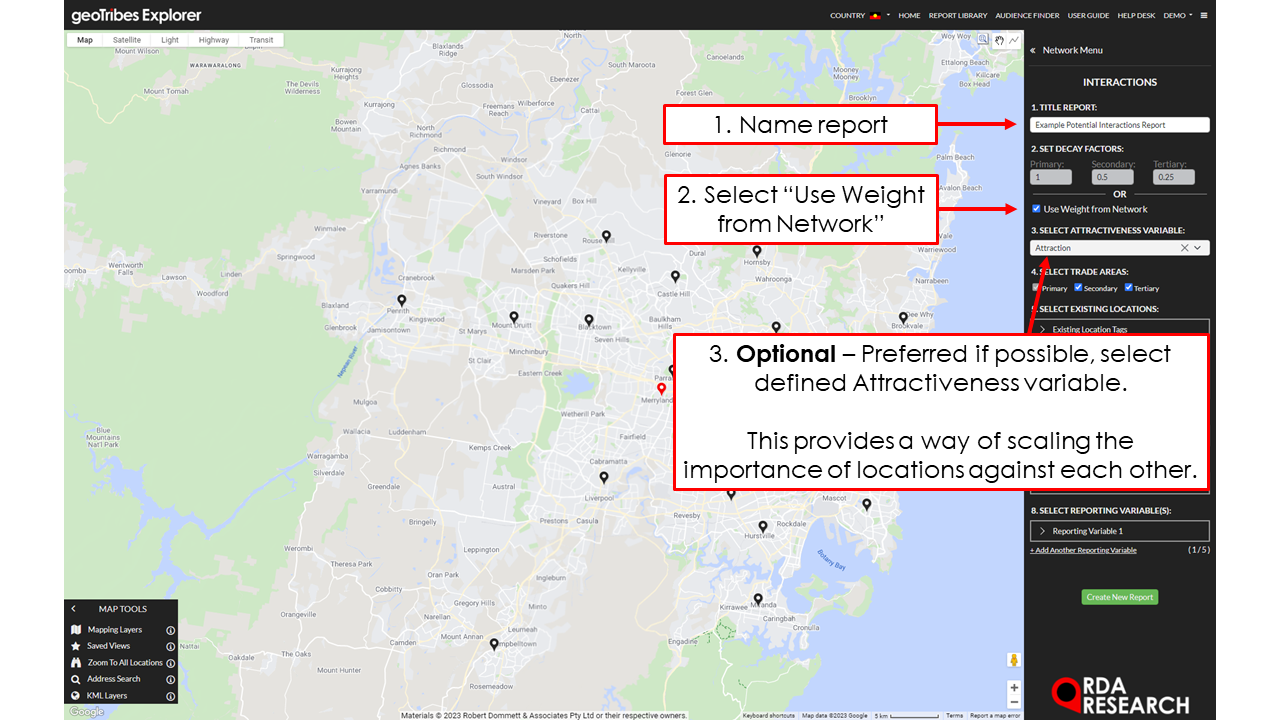
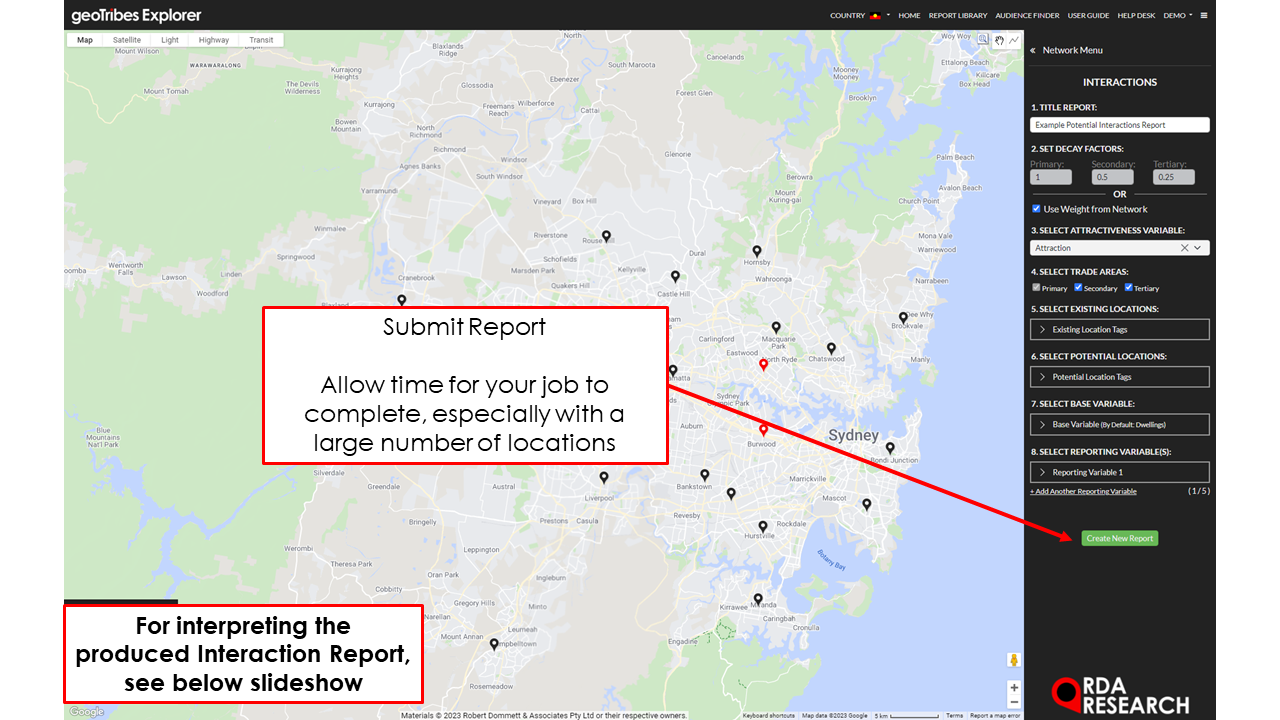
1. Title Report - Name your report so it can be identified from the Report Library later. (This can be edited inside the Report and Report Library'.
2. Set Decay Factors - Check on “Use Weight From Network”
3. Select Attractiveness Variable (OPTIONAL) - Assign your attractiveness parameter (A Location Attribute prepared earlier)
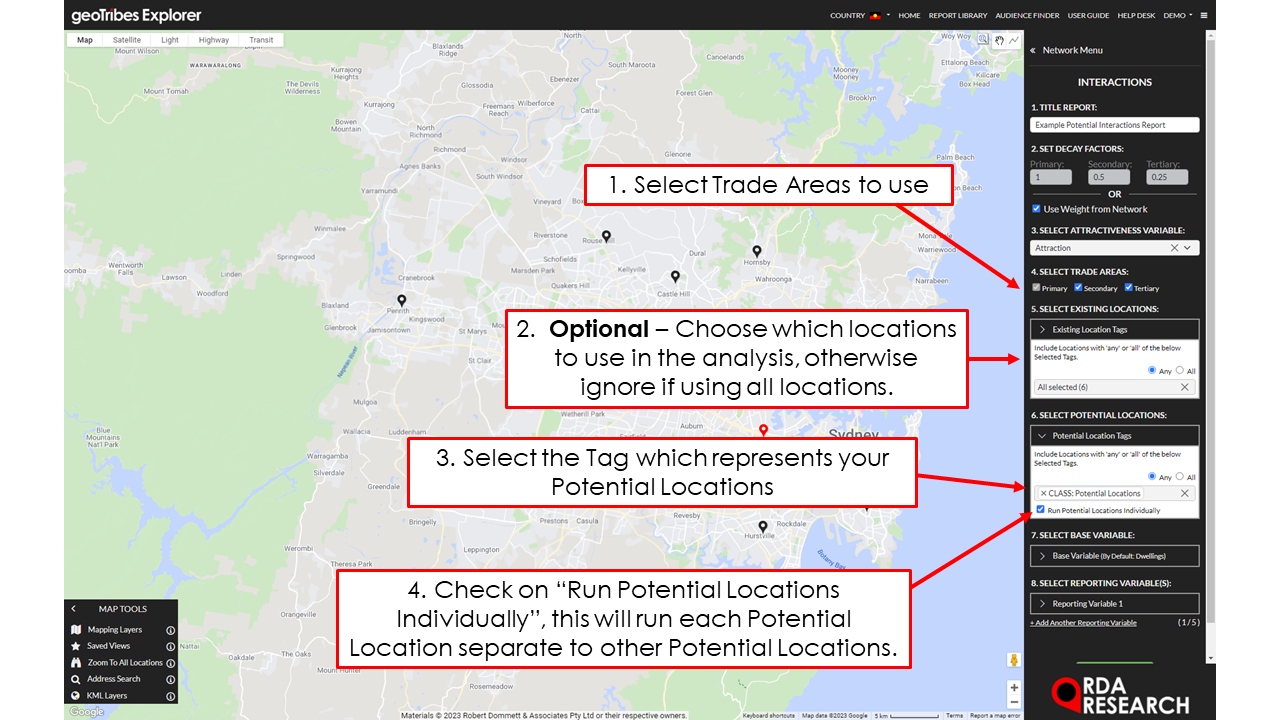
4. Select Trade Areas (IGNORE) - Select which trade areas are to be used to determine influence.
5. Select Existing Locations - Filter relevant locations to use in the interactions report.
6. Select Potential Locations - Assign the Tag representative of the Potential Locations, click “Run Potential Locations individually”. If you wish to simulate all Potential Locations appearing simultaneously within the Network leave this box unticked.
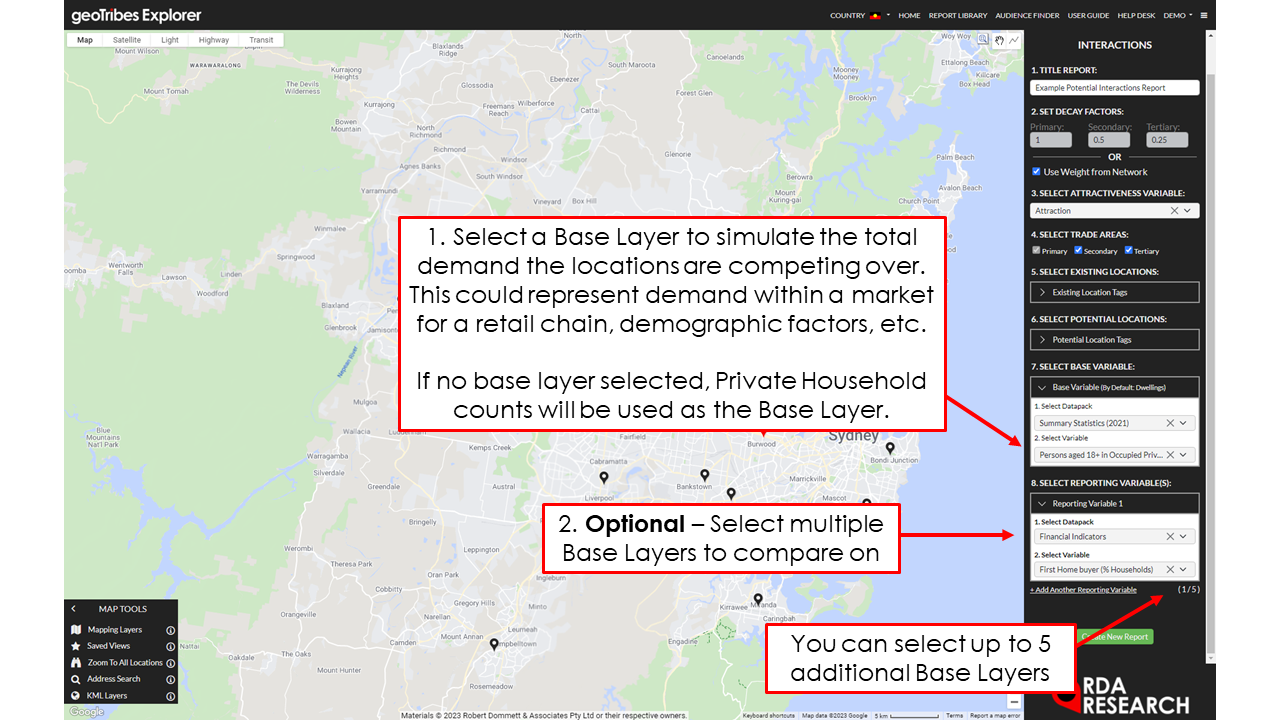
7. Select Base Variable (OPTIONAL) - Determine what the influence will be measured over. At times the area of interaction may be concentrated in different areas as to what is commonly being used, e.g. (Dwellings)
8. Select Reporting Variable - To add optional, additional variables to be included in the analysis.
Click 'Create Report' to generate Report.
Understanding a Potential Report

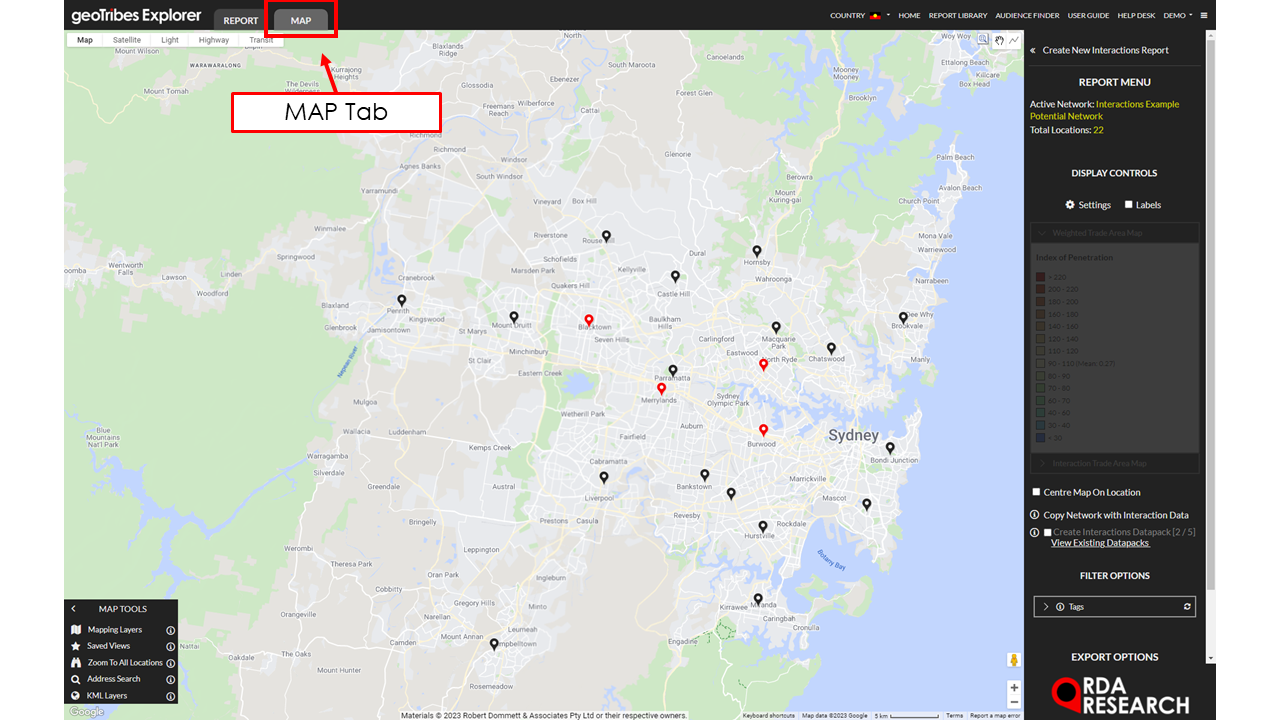
The Report Table comprises the included Network Locations (rows) and a range of Interaction measures (columns). Within each row (left of Location Name) is a link to view the Location in the Report Map (Map icon).
There are two main features for Interaction Reports:
Demand Summary: Displays a summary of total demand for each variable based on all locations within the report. This table is responsive to any filters and will only display demand for locations visible within the report table.
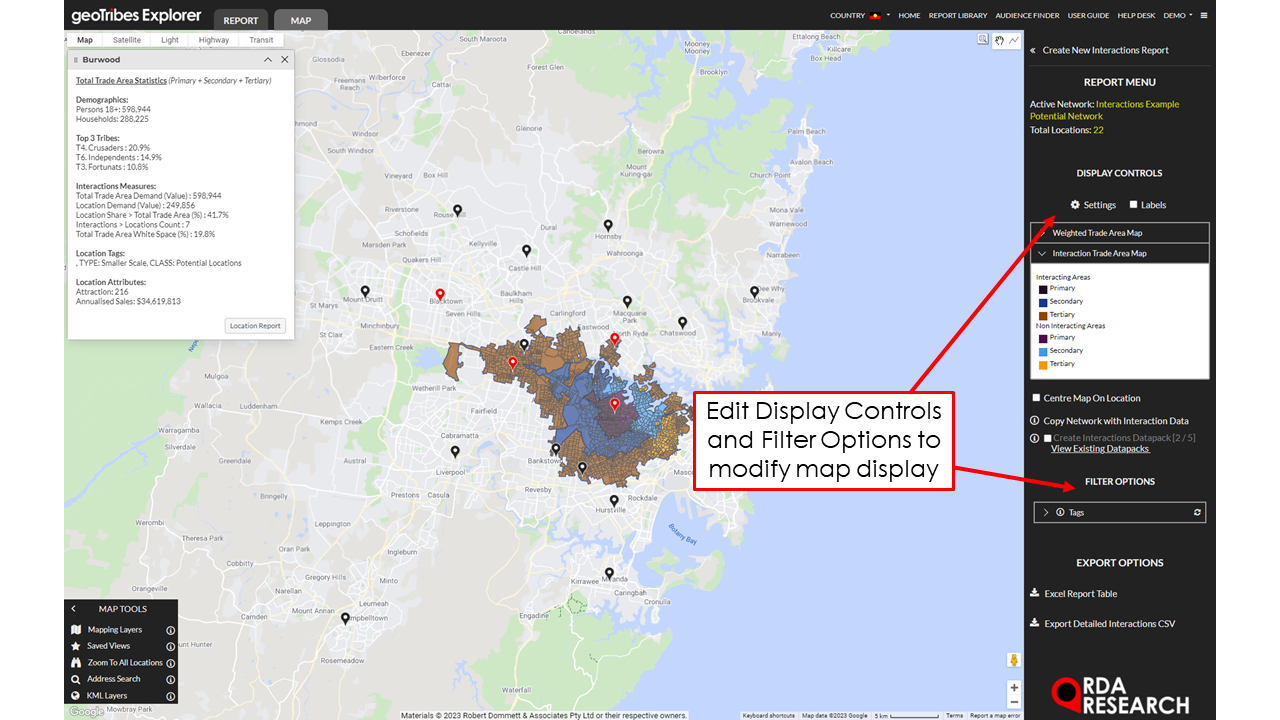
Filter Control: Use the 'Search' bar at the top of the table to only include locations with particular characters in their name. Alternatively, users can use the drop down “Tag” menu underneath “Filter Options” to include Locations with 'Any' or 'All' of the defined categorical Tags. The report map is responsive to tag selection and will only display locations with the selected tags and any locations which interact with them.
There are two levels to the report:
Level 1 - Location Performance Summary
Level 2 - Interacting Locations Listing
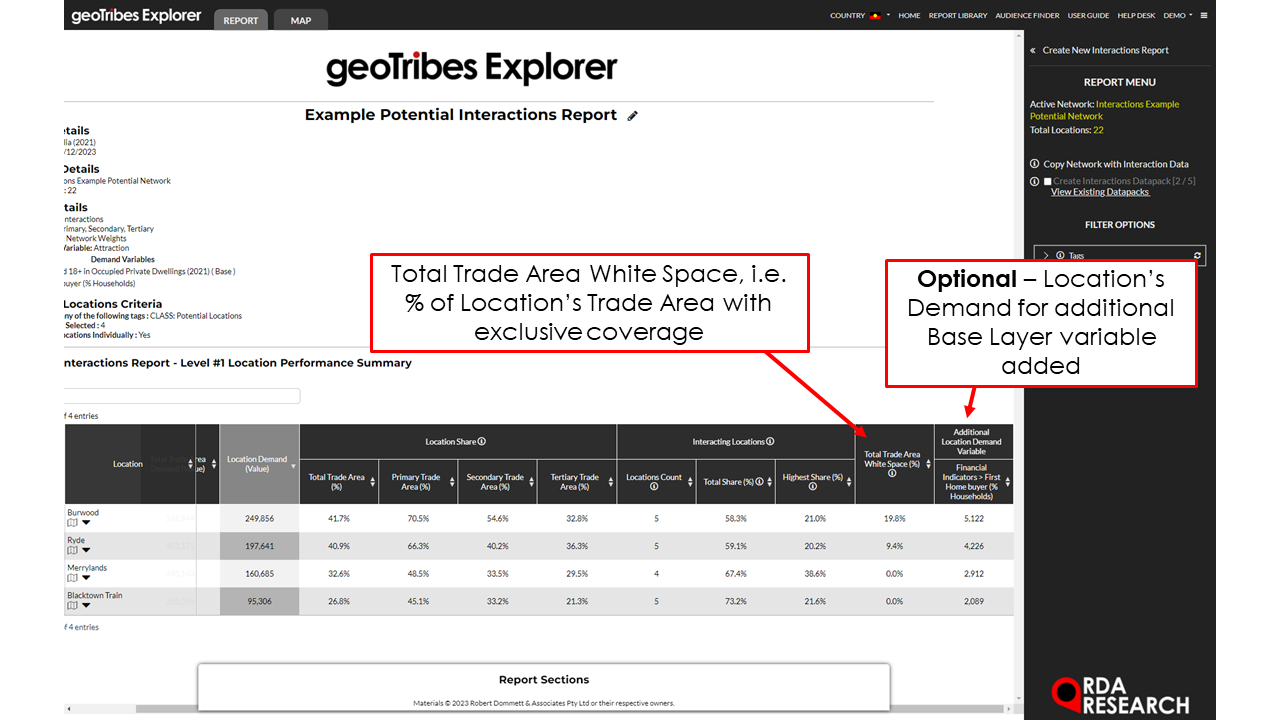
Level 1 - Location Performance Summary
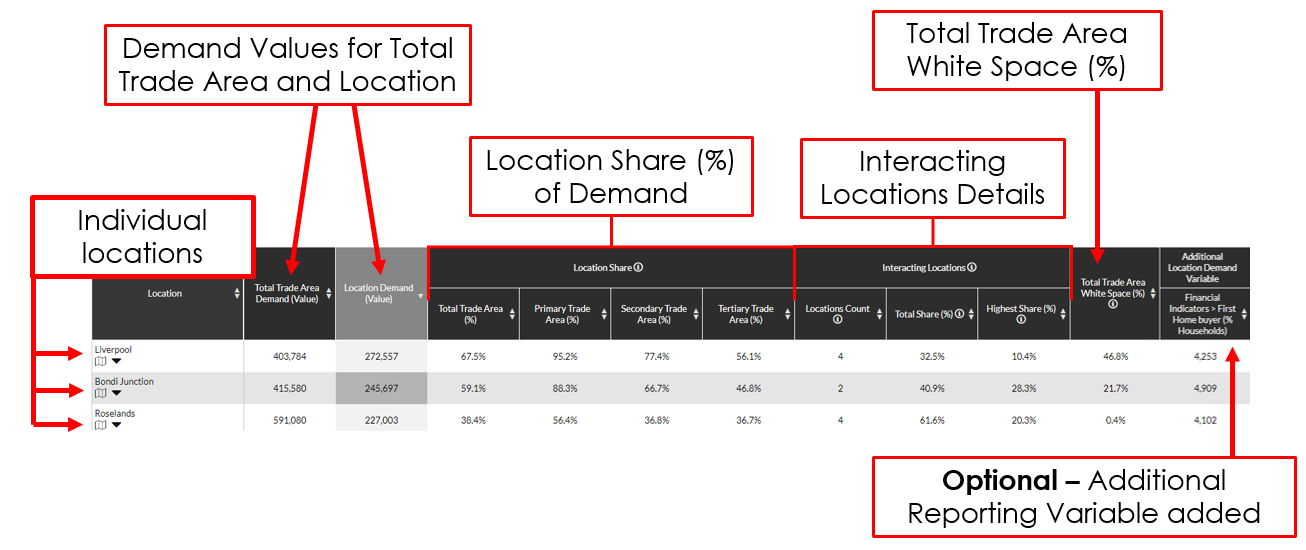
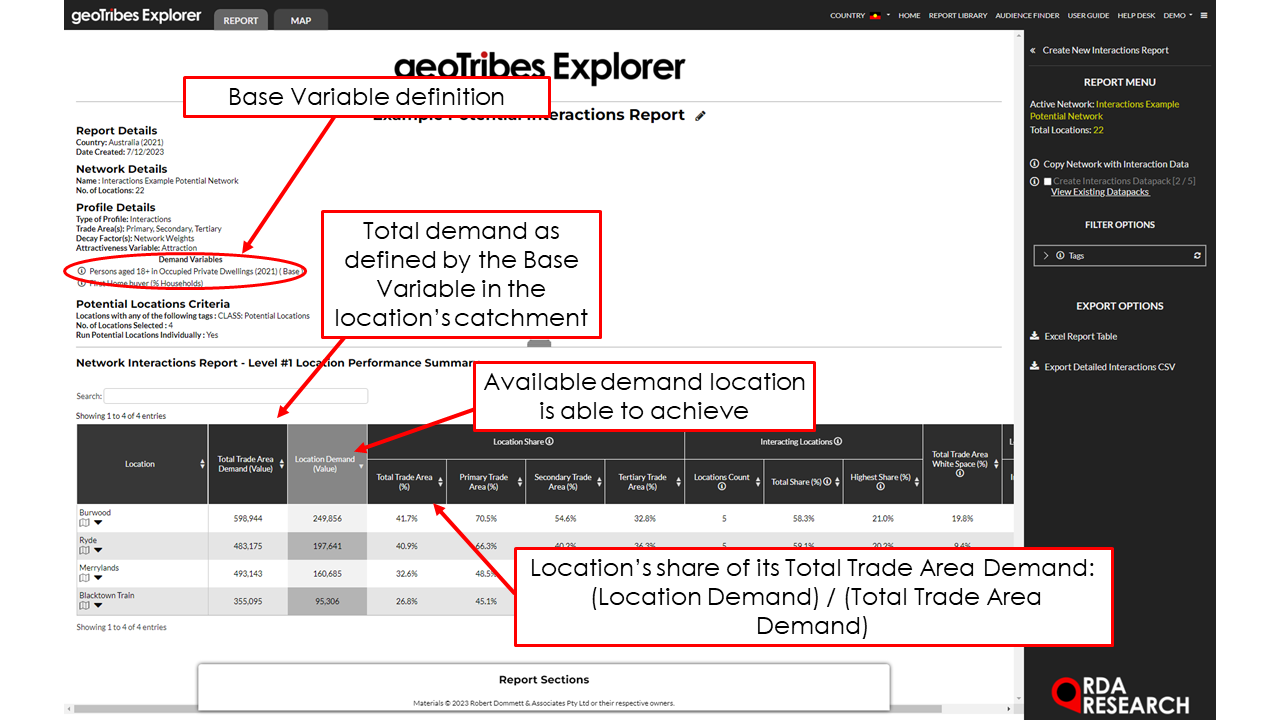
This level gives a general overview of the performance of each location with respect to how much demand it has access to within its trade area. It also shows the degree of overlap between a location’s Trade Area and others in the network.
Total Trade Area Demand (Value): Measures total demand in a location’s Trade Area.
Location Demand (Value): Measures the demand a location extracts from within its Trade Area.
Location Share (%)
Total Trade Area: Shows the the proportion of Location Demand which is extracted from its Trade Area
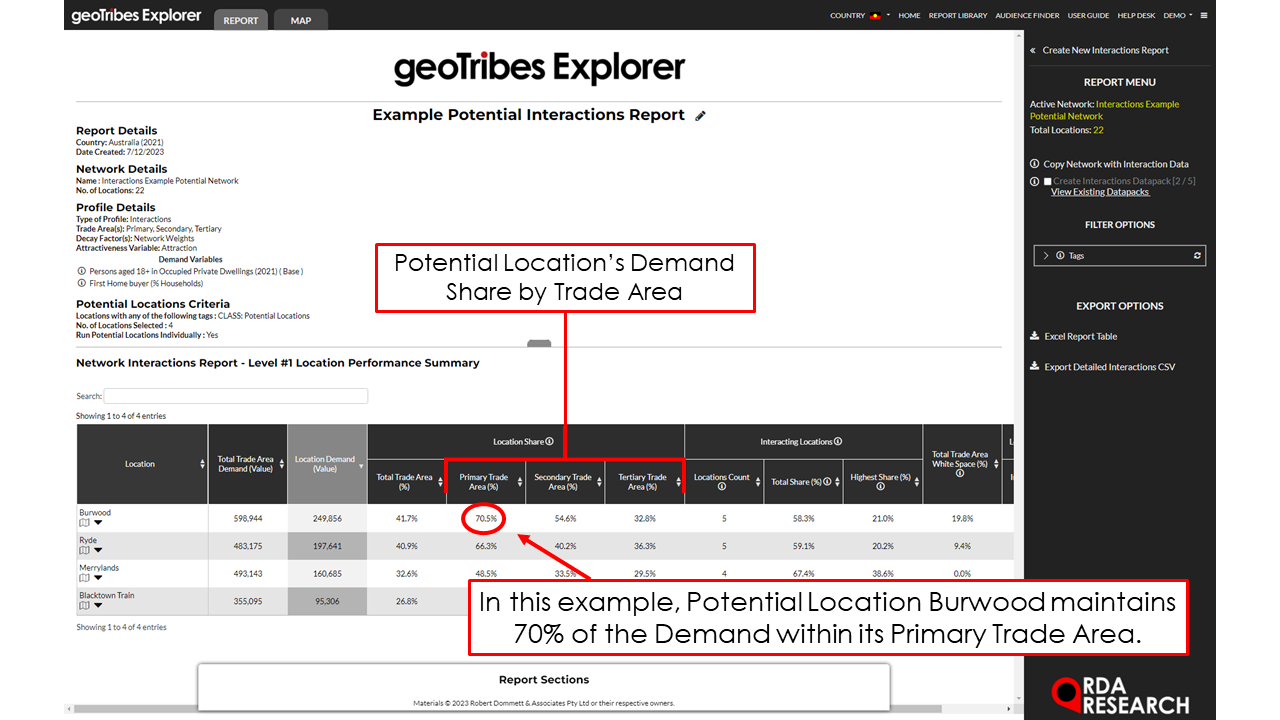
Primary, Secondary and Tertiary Trade Area: Shows the proportion of Location Demand BY Trade Area, useful in determining how close interacting locations are..
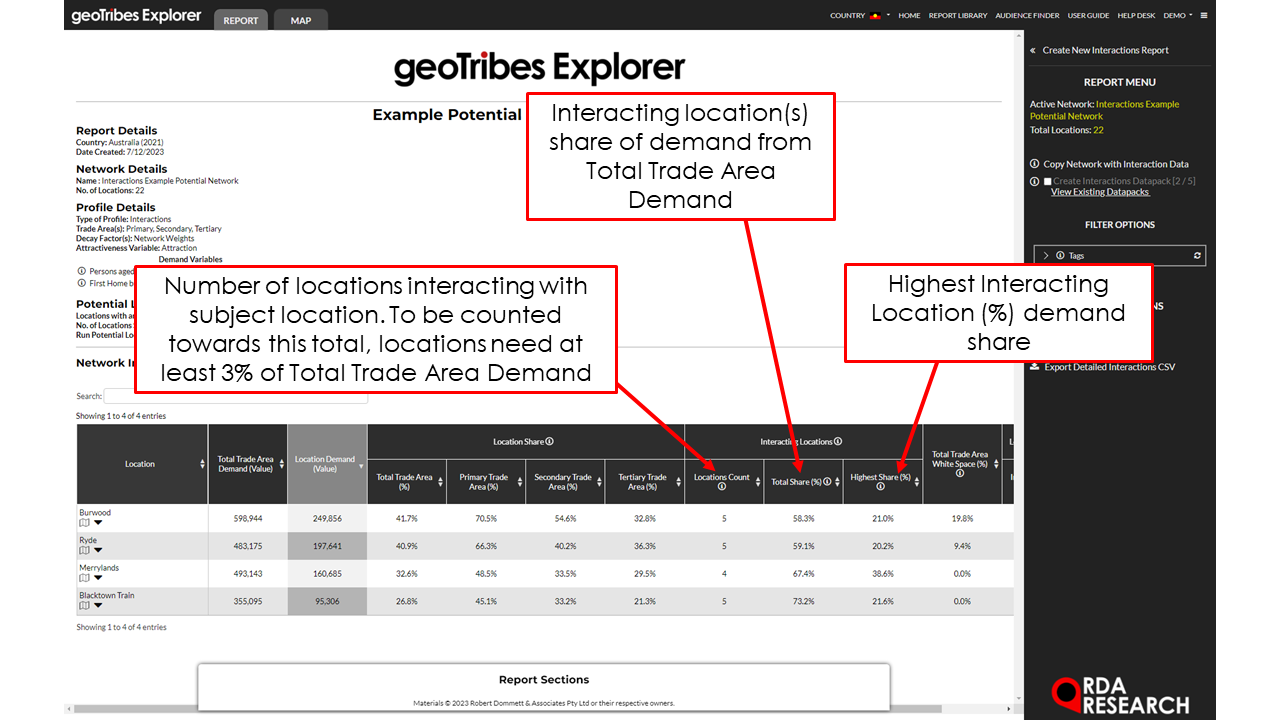
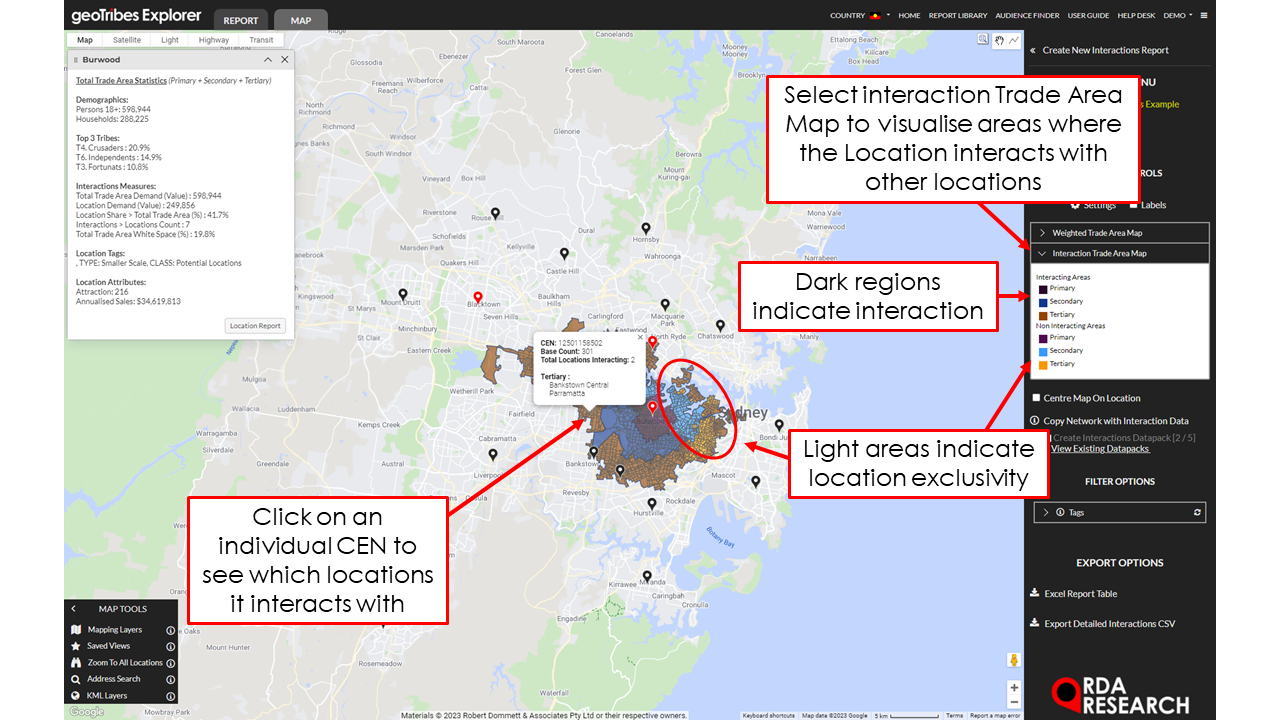
Interacting Locations: Shows the extent to which a location interacts with others in the network.
Locations Count: Provides a count of SIGNIFICANT Interacting locations that occupy more than 3% of the Demand within the Location’s Trade Area.
Total Share (%): Provides the combined % of trade area demand that is owned by Interacting Locations.
Highest Share (%): Provides the highest % of trade area demand owned by an interacting location.
Total Trade Area White Space (%): Measures the proportion of the location’s total trade area demand which is uncontested.
Additional Location Demand Variables: Measures the demand each location extracts for any additional reporting variables (if any were selected).
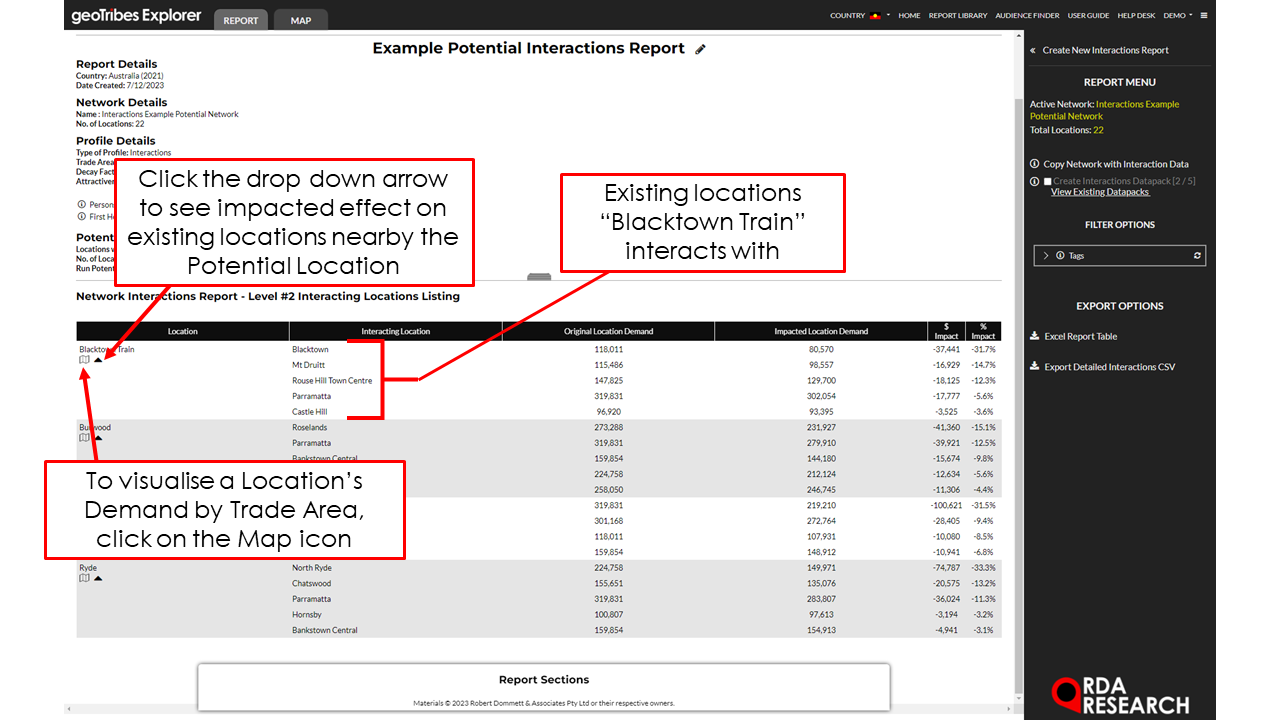
Level 2 - Interacting Locations Listing
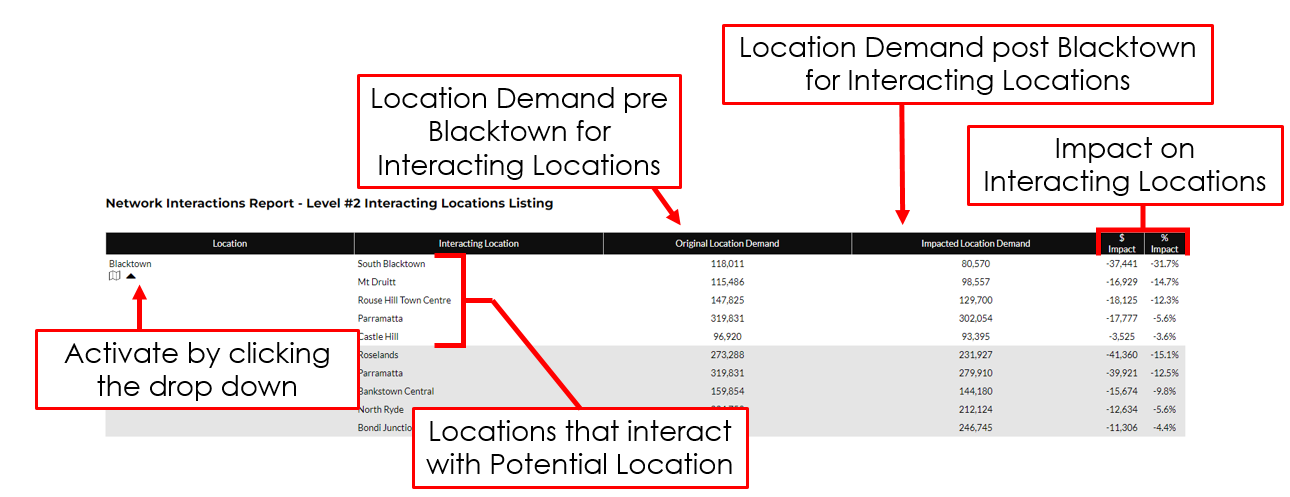
This level measures the impact of the Potential Location on all Interacting Locations with an Impact (%) greater than 3%.
Interacting Location: Provides a list of all Interacting Locations affected by the Potential Location appearing.
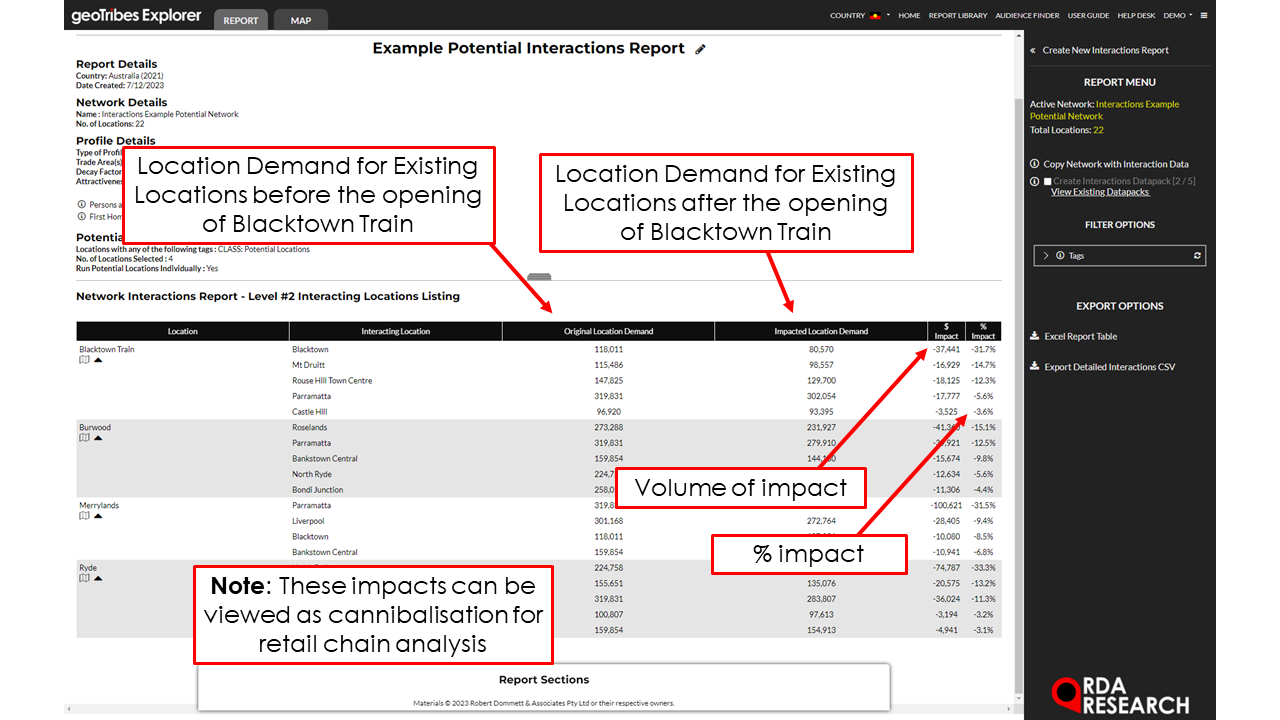
Original Location Demand and Impacted Location Demand: Provides the before and after measure of Location Demand for the Interacting Measures.
Impact ($/%): Provides a measure of volume and % impact for the Interacting Locations.
Applications - Retailers can use the Level 2 Interaction Report for dollar estimates on cannibalisation along with expected (%) Impact on competitor stores.
Export
'Excel Report Table' creates an Excel spreadsheet of all the Report Tables.
‘Detailed Interactions CSV’ creates an Excel spreadsheet with a detailed break down of each locations trade area demand for each census area.
‘Copy Network With Interaction Data’ creates a new network with the Potential Locations, updating each location’s attributes with the trade area data created from the report.
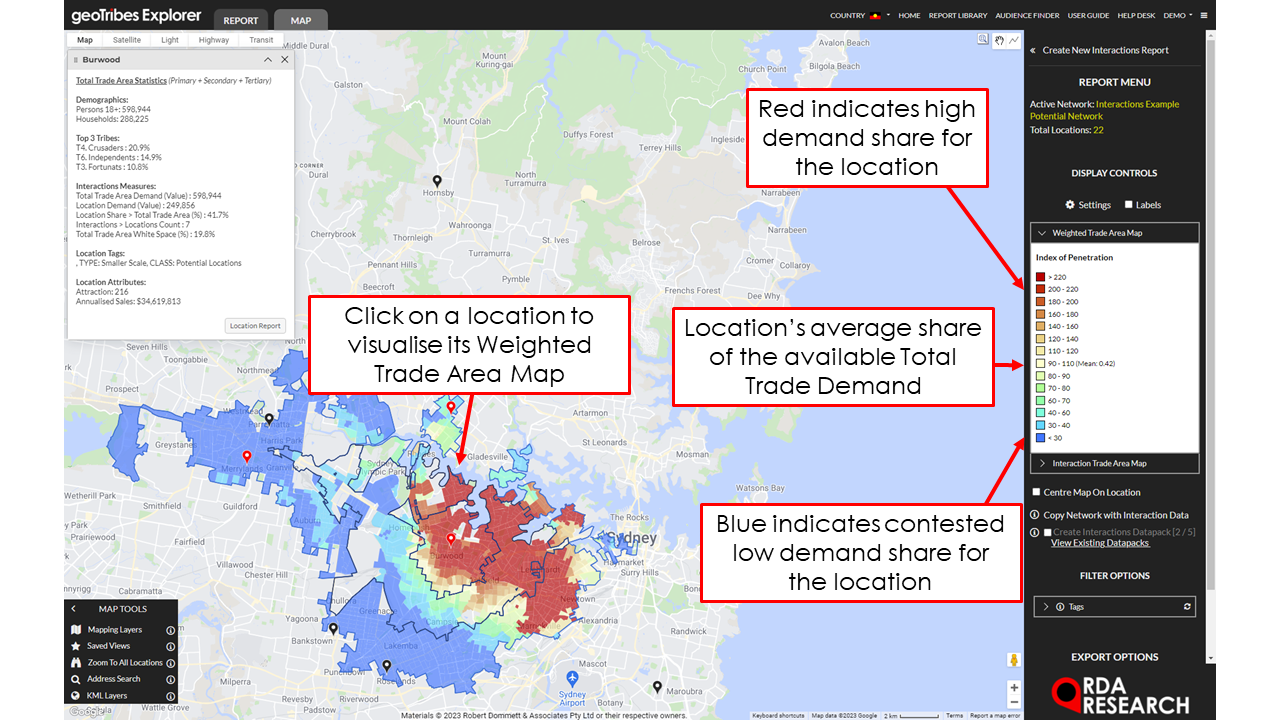
‘Save as Weighted Network’ enables users to view the Potential Location’s trade areas as an index of its the demand it controls in its trade area relative to competitors. This can be accessed by clicking on an individual location’s icon on the map.